Thinking about how people get around locally the other day, I thought that a flow chart could be a good way of visualising why I think making our local streets safer will improve transport choice/options. First point is the recognition that the principle cause of road danger comes from motor vehicles on our roads. (See Road Danger Reduction Forum for more info on this)
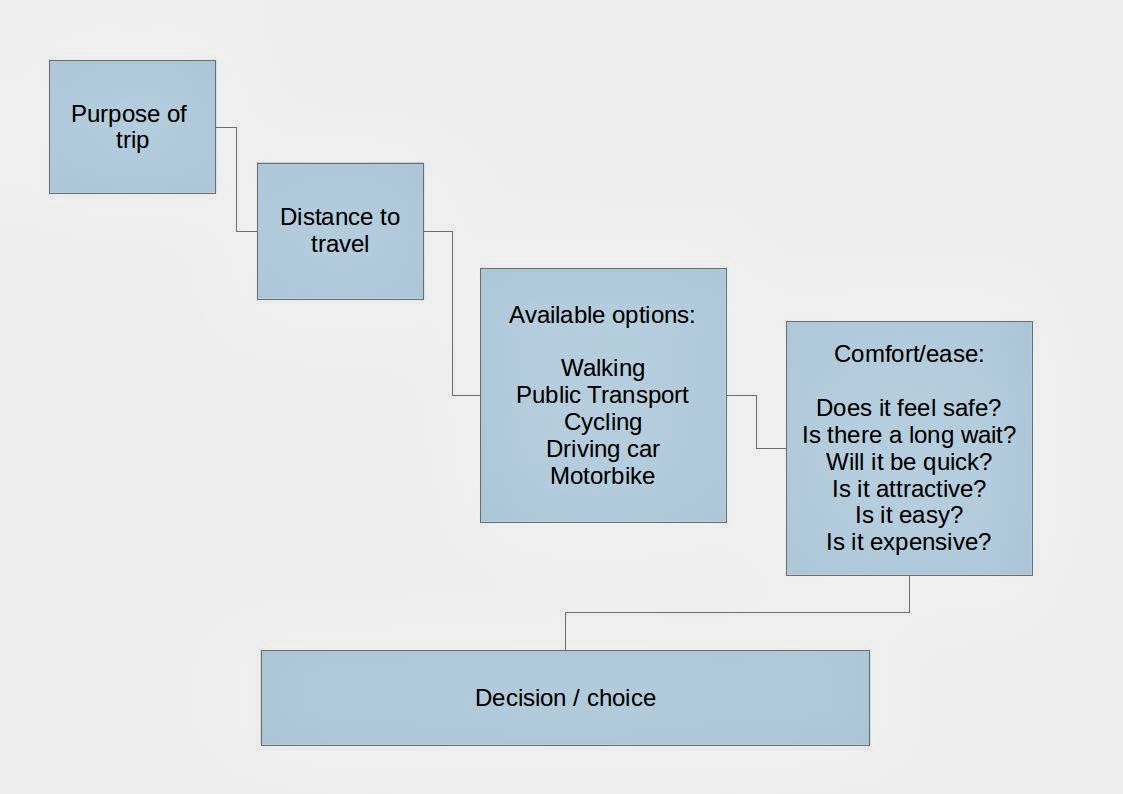
Second is how we make decisions in terms of local trips. Broadly I think the following variables come into play:
1. Purpose of trip
2. Distance to travel
3. Available options
4. Ease/comfort of journey
There may well be others, but I think these really cover it. I'm also sure that academics will have done something similar. If you know, then please do comment with a link at the bottom.
The first point could be described as the 'function of the trip/journey'. Examples could be, going to the shops, getting the children to school, going to work. The second point clearly depends on the first and will vary accordingly.
The third one is different clearly for everyone. Broadly speaking, walking, walking and public transport, walking and driving (private car/scooter/motorbike), walking and cycling. With car clubs and taxis/mini-cabs in my mind we can lump them together with public transport.
The fourth and final point, is how easy or comfortable will the trip be based on the the other points. For some, doing a big shop, will mean that they need to use the bus, or a taxi/mini cab to get their groceries home. Others will drive their car, and some ride a bicycle.
Public transport has experienced a huge growth period in the past 15-20 years in London. As I understand it, the availability and reliability of the bus network has improved significantly. Also a lot of work has been done to promote bus travel, and reduce fears about safety when using the bus network.
When it comes to walking or cycling progress is being made belatedly. According to TfL's 'Attitudes towards Cycling report' from March 2012 whilst 86% of Londoners know how to ride a bicycle, and 50% have access to a bicycle the report highlights that 'concern about safety is the most commonly mentioned deterrent to increasing/taking up cycling'.
The petitions and campaigns I've been running locally, are about creating a safer street environment. I believe that if we do that the options in terms of how people travel locally will increase. The failure to address the very real danger presented by motor traffic for years, has resulted in cycling being effectively removed as a viable choice for most people. The consequences are more congestion, more strain on public transport, and unacceptably high levels of people getting hurt on our streets. Mistakes people make behind the wheel of a car/van/lorry or bus sadly too often result in terrible consequences for people who are caught on the outside.
Nice explanation with the flow chart and your visualization is very helpful, thanks a lot for sharing the information,
ReplyDeleteRegards, cabs in hyderabad